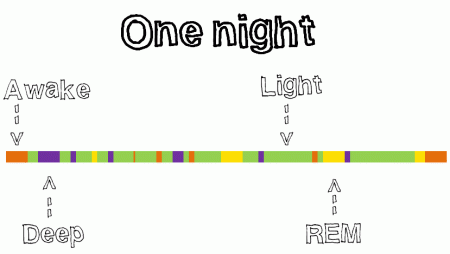
How to color code your zeo sleep data
/ Instructions and template for how to format zeo sleep using excel conditional formatting
- 1. export zeo sleep (it's the itty-bitty link underneath the green - manage your data button on the myzeo page)
- 2. open the excel file and highlight column BW - 5 min, detailed sleep
- 3. click Data--> text to columns --> select delimited (next) space (next) finish
- 4. do you want to replace? yes, then select most the columns with data (it'll be ragged cause amount of sleep varies)
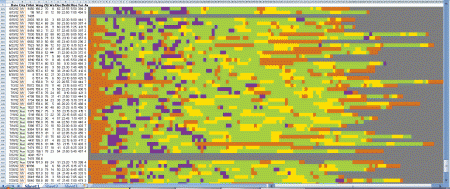
- 5. open and use my sample excel sleep chart of 31 nights here --> Sleep_zeo_reformatted
- 6. copy and paste your data into the color formatted columns of the sample sheet - might have to select all the columns you pasted, right click and set column width to '1'
- 7. if you want to lengthen or change, just go into conditional formatting tab --> edit and change the cell range to cover the data you want to use the same colored formatting
- 8. fiddle around with copy/pasting from your data into the sample adding/deleting columns, better to just keep the ones that matter to you. Then you can play with excel to find mean, standard deviation and experiment with the correlate function.
- 9. I've added my withings weight, fitbit steps and city location to the same file - easy to delete those columns.
- 10. yippee, you're there !


