Making work
/ Hate to have so much time go by without an update. Had a little talk with myself that all energy needed to go into the making of work for this year. From a distance the life of a working artist looks leisurely with no boss, no deadlines and lots of time. Right.
Am juggling work for 2 upcoming shows, a lobby installation, commission, group show, couple benefits and two upcoming art fairs.
On the measurement side, have been analyzing all the data I'm getting from my Basis watch (we hacked the download of data - cause they are offering no data export, ugh). From little sensors on the wrist side of the watch strap, it measures pulse, air temperature, skin temperature, galvanic skin response, calories and movement. Once every minute. It's a ton of data, but you get a very interesting picture of 'you', and in this case, me....over 24 hours, day after day. Have been fiddling with how the data tells a story, stay tuned...will post soon.
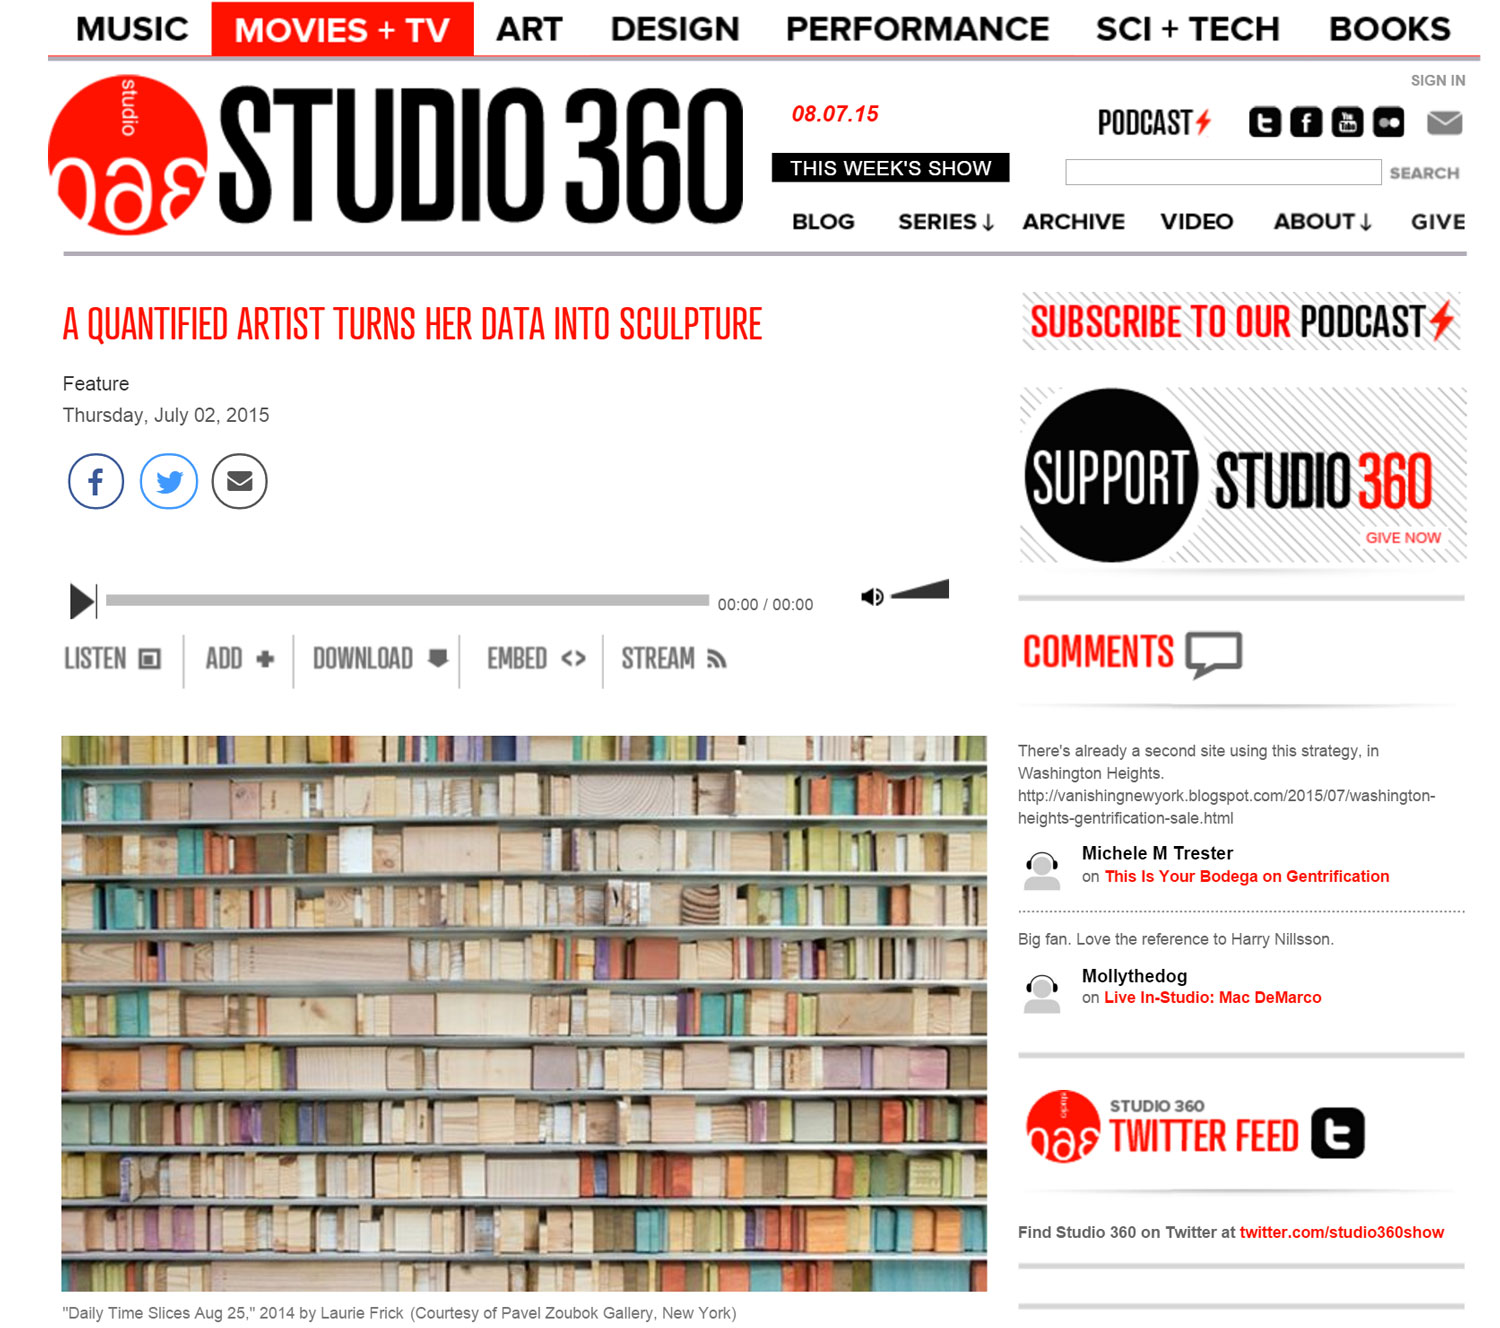
The image here has just been sitting in my pic file, and it grabs me everytime I see it...something about the movement and stance of the 2 viewers...the fact that they were both wearing black and seem to have come to really look at work in the booth. Was a great fair, and Edward Cella did a superb job at this show.
OK, back to work.
Austin scientist self-tracking experiment includes 3x weekly brain scan
/Austin NPR story about self-tracking, and Russ Poldrack's brainscanning as part of his year-long measurement study. I chat a little about tracking my upset stomach. Here's the newsbit plus 7 min radio story. Russ runs the Neuroscience lab at UT, where I'm artist-in-residence. Listen to the radio story here.
This Austin Scientist is Scanning His Own Brain Over 100 Times
By Matt Largey, KUT News

UT neuroscientist Russ Poldrack is studying his own brain, looking at how it changes over time.
At 7:30 am on pretty much any Tuesday over the past 8 months, you'd find Russ Poldrack lying on his back in front of the MRI scanner in his basement lab at UT, waiting to scan his brain.
Poldrack, a neuroscientist, runs the Imaging Research Center at UT-Austin.
I met him on the morning of his 58th scan.
“The first few times, I was quite anxious laying in there," Poldrack said. "But 50 times doing anything, you become more relaxed in doing it.”
Poldrack gets one of his regular Tuesday brain scans in the MRI machine in his basement lab. His assistant, Ashleigh Hover, runs the scanner.
All these MRI's are aimed at trying to answer a pretty fundamental question about all of us: How much fluctuation is there in a healthy brain over time? But also – how do those fluctuations translate into real things?
“So for example," said Poldrack, "how does that relate to my mood from day to day or how well I slept and also how does it relate to what’s going on in my body?”
Put simply: How do changes in our brains affect how we feel or how we act?
To find out, Poldrack is tracking virtually every aspect of his daily life. When he wakes up every morning, he takes his blood pressure, weighs himself and takes a survey about how he slept and how he's feeling that morning. Some days, he gets blood taken and analyzed. Each night he takes another survey to track what happened that day — what he ate, if he drank any alcohol or took any medicines.
Then there are the MRIs. He’s been doing at least two scans a week since September, with the exception of a brief hiatus this spring.
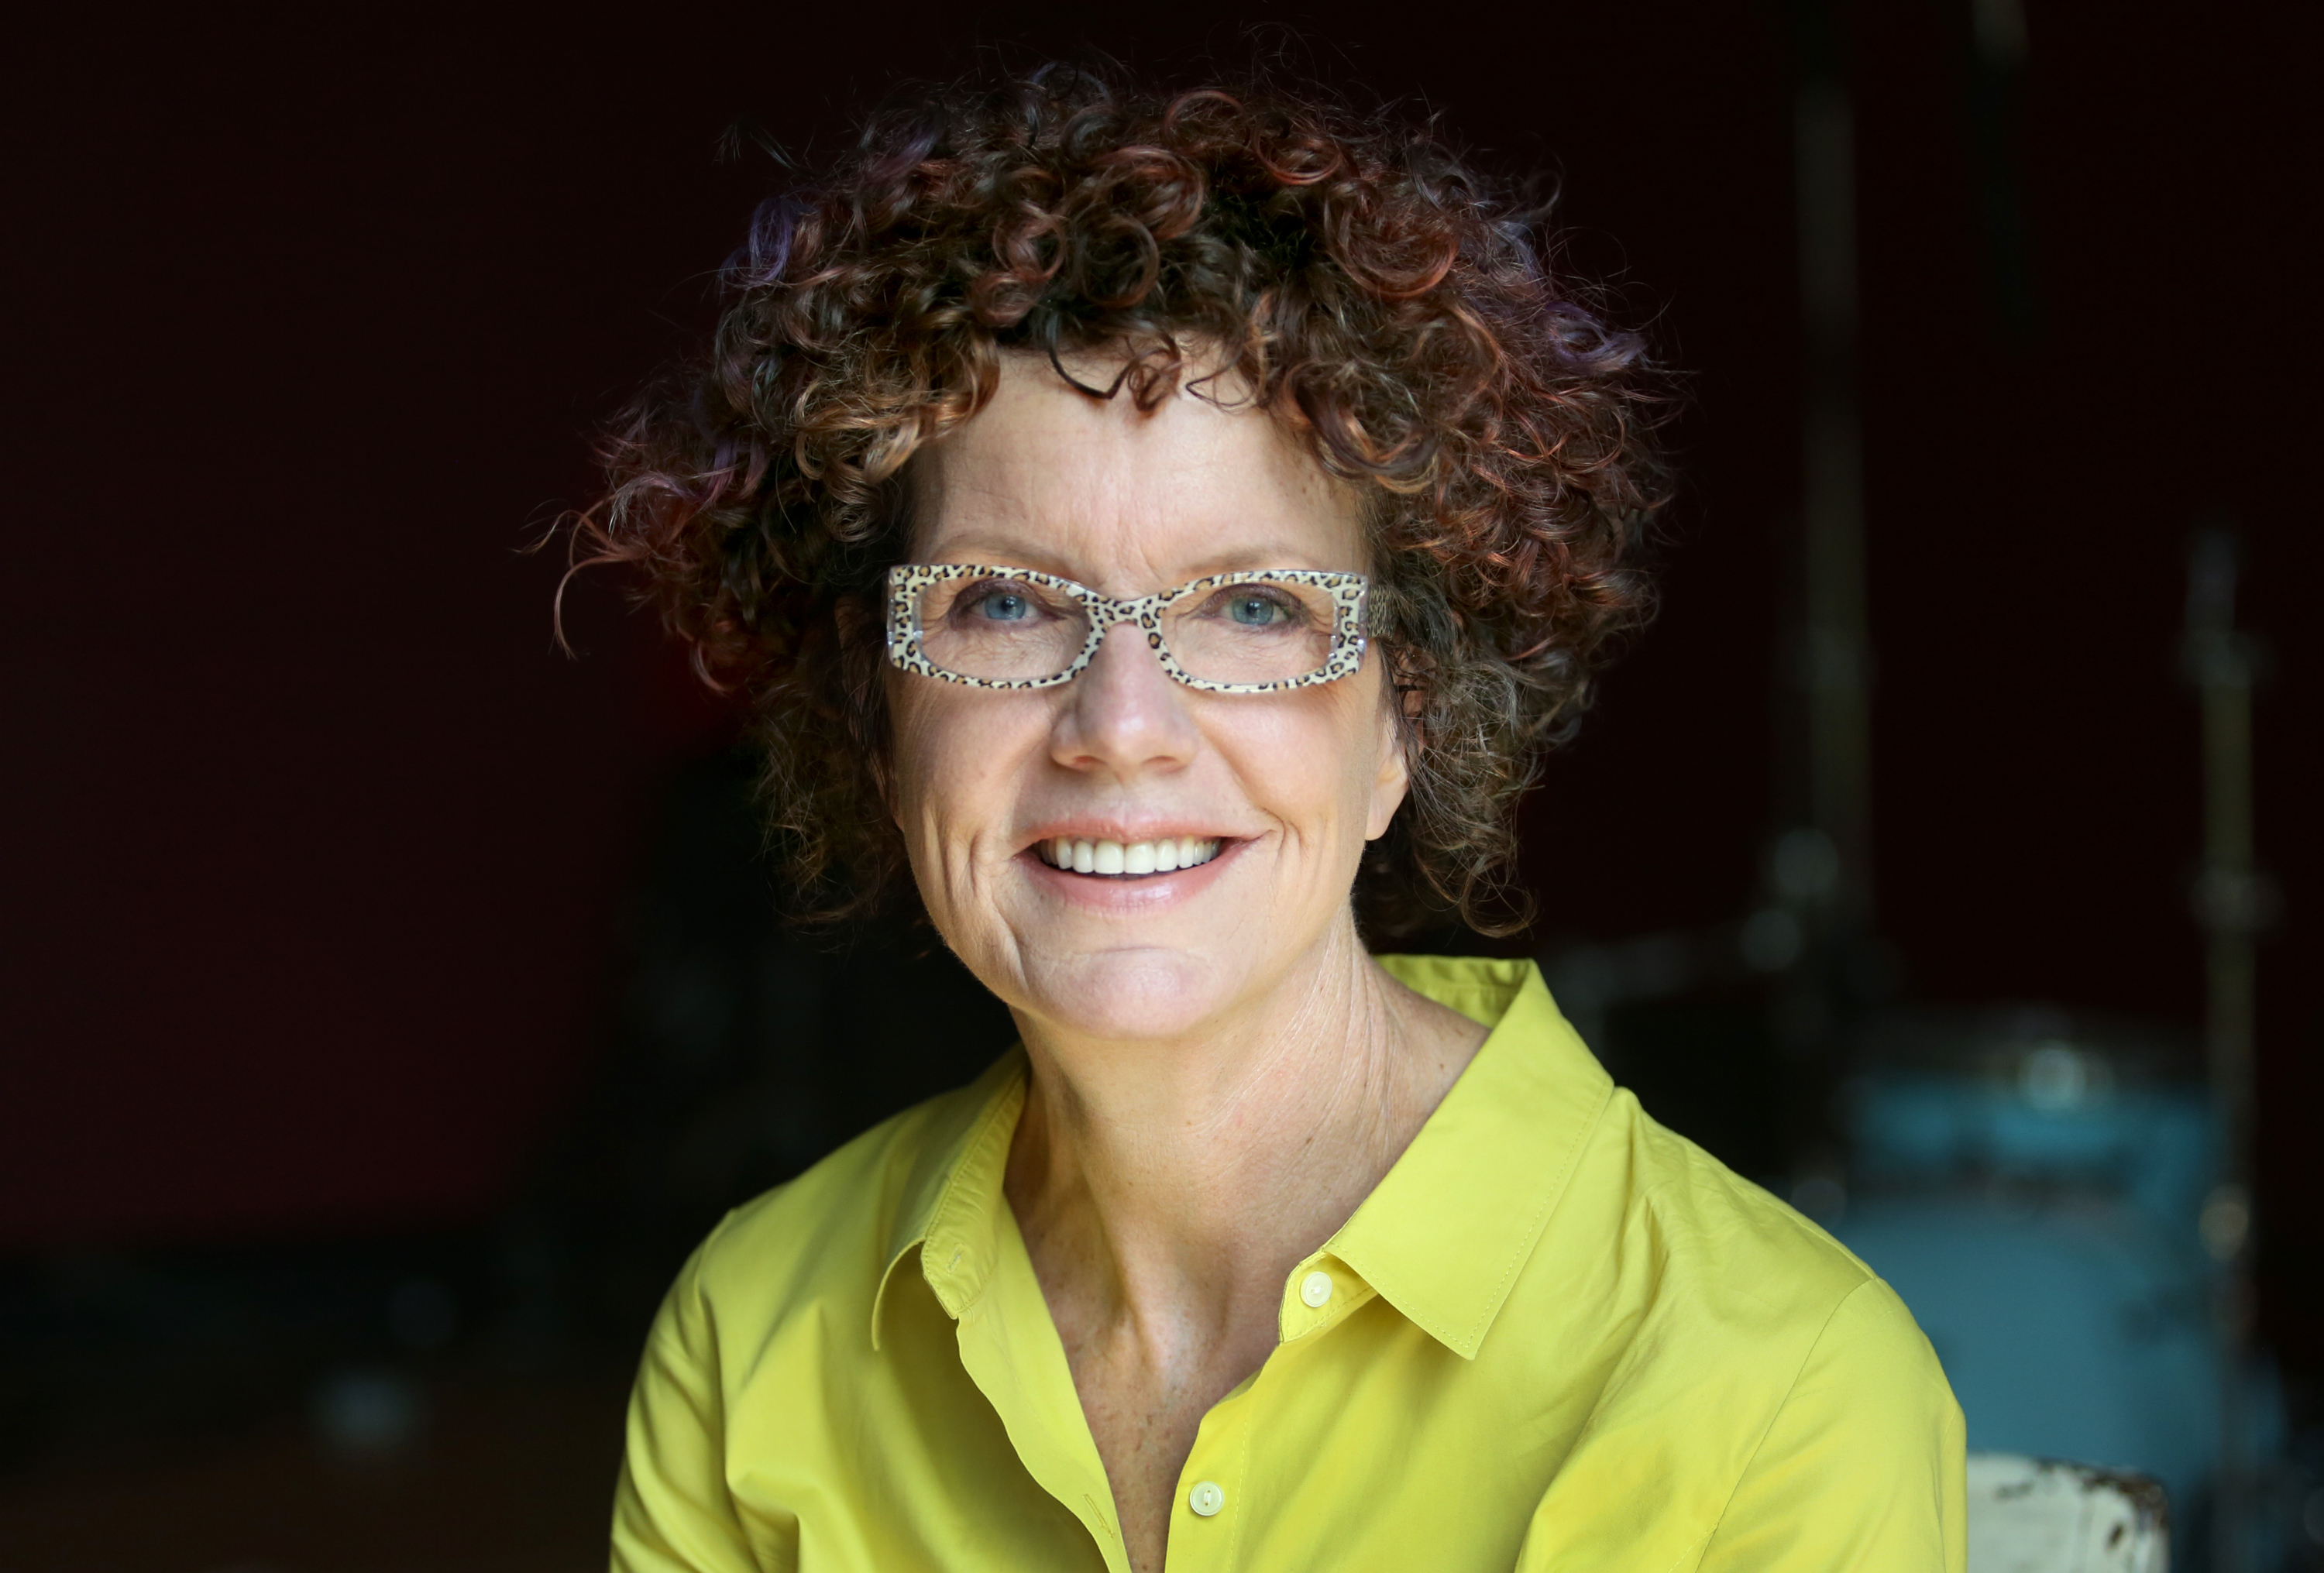
So why is Poldrack – the scientist – the one having his life tracked this way, instead of a test subject? Poldrack says the inspiration came from an artist by the name Laurie Frick, who's sort of an artist-in-residence at Poldrack's lab. Frick has been tracking herself for years and making art from the data. But she got started with a more practical purpose.
Credit Jorge Sanhueza-Lyon/KUT News
Austin artist Laurie Frick was one of the inspirations for Poldrack self-tracking study.
“I’d been having these stomach aches on and off for years and years and years," Frick said. "And I thought ‘alright, I’ll start to score it every day.’”
She used an app to track what she ate, what she did each day and some other factors. “And after about a year I decoded it," she said. "By tracking it, I figured out what were the causal effects of an upset stomach.”
And in a sense, that’s just what Poldrack is doing. He's tracking little things to try to get big answers.
After his MRI, Poldrack takes his blood pressure for the second time that day. Then, over to a computer to use an online form to answer a few dozen questions about his mood. Is he feeling proud? Shy? Bashful? Frightened? Poldrack rates himself for each on a scale of 1 to 5.
Let’s say he's feeling a little blue one day. The idea is to compare his brain scans from that day to ones from days when he’s feeling happy or just neutral.
Can you actually see something in his brain has changed?
But shouldn’t a real-deal scientist be doing this a little more by the book? Test subjects, control groups – you know, a real study?
Poldrack says there’s just one problem with that.
“Imagine expecting volunteers to come in off the street, say, once a week for a year…have their brain scanned, have blood drawn…that’s a really hard study to expect people to take part in.”
Poldrack is hardly the first scientist to use himself for an experiment.
A few years ago, Trevor Norton, a retired professor of marine biology, wrote a book called Smoking Ears and Screaming Teeth. And it’s about the long history of scientists who made big discoveries by experimenting on themselves. “Isaac Newton in the 16th century…John Hunter in the 18th Century...it was an American dentist [Horace Wells] who was the first one to try anesthetics properly.” One of the inventors of the MRI tried out an early version of the machine (unsuccessfully) on himself.
And while Poldrack isn't trying a new medical tool or taking some untested drug, there’s something idealistic about what he's doing. It’s the kind of science you don’t see much of anymore.
“It’s not a matter of getting really good data," said Norton. "It’s ‘Who goes first?’”
After the MRI and the blood pressure and the mood survey, Poldrack goes to get some blood drawn. It will be analyzed to isolate the RNA — which carry the blueprints to make proteins. The results of the analysis will tell him which of his genes are being expressed that day. Then, he can compare that to all the other data to see if it corresponds to any changes in brain.
Whatever he learns is obviously just a first step. The idea is to find specific questions to ask in the future.
"Whatever we find in this study will really provide us sort of places to look," Poldrack said.
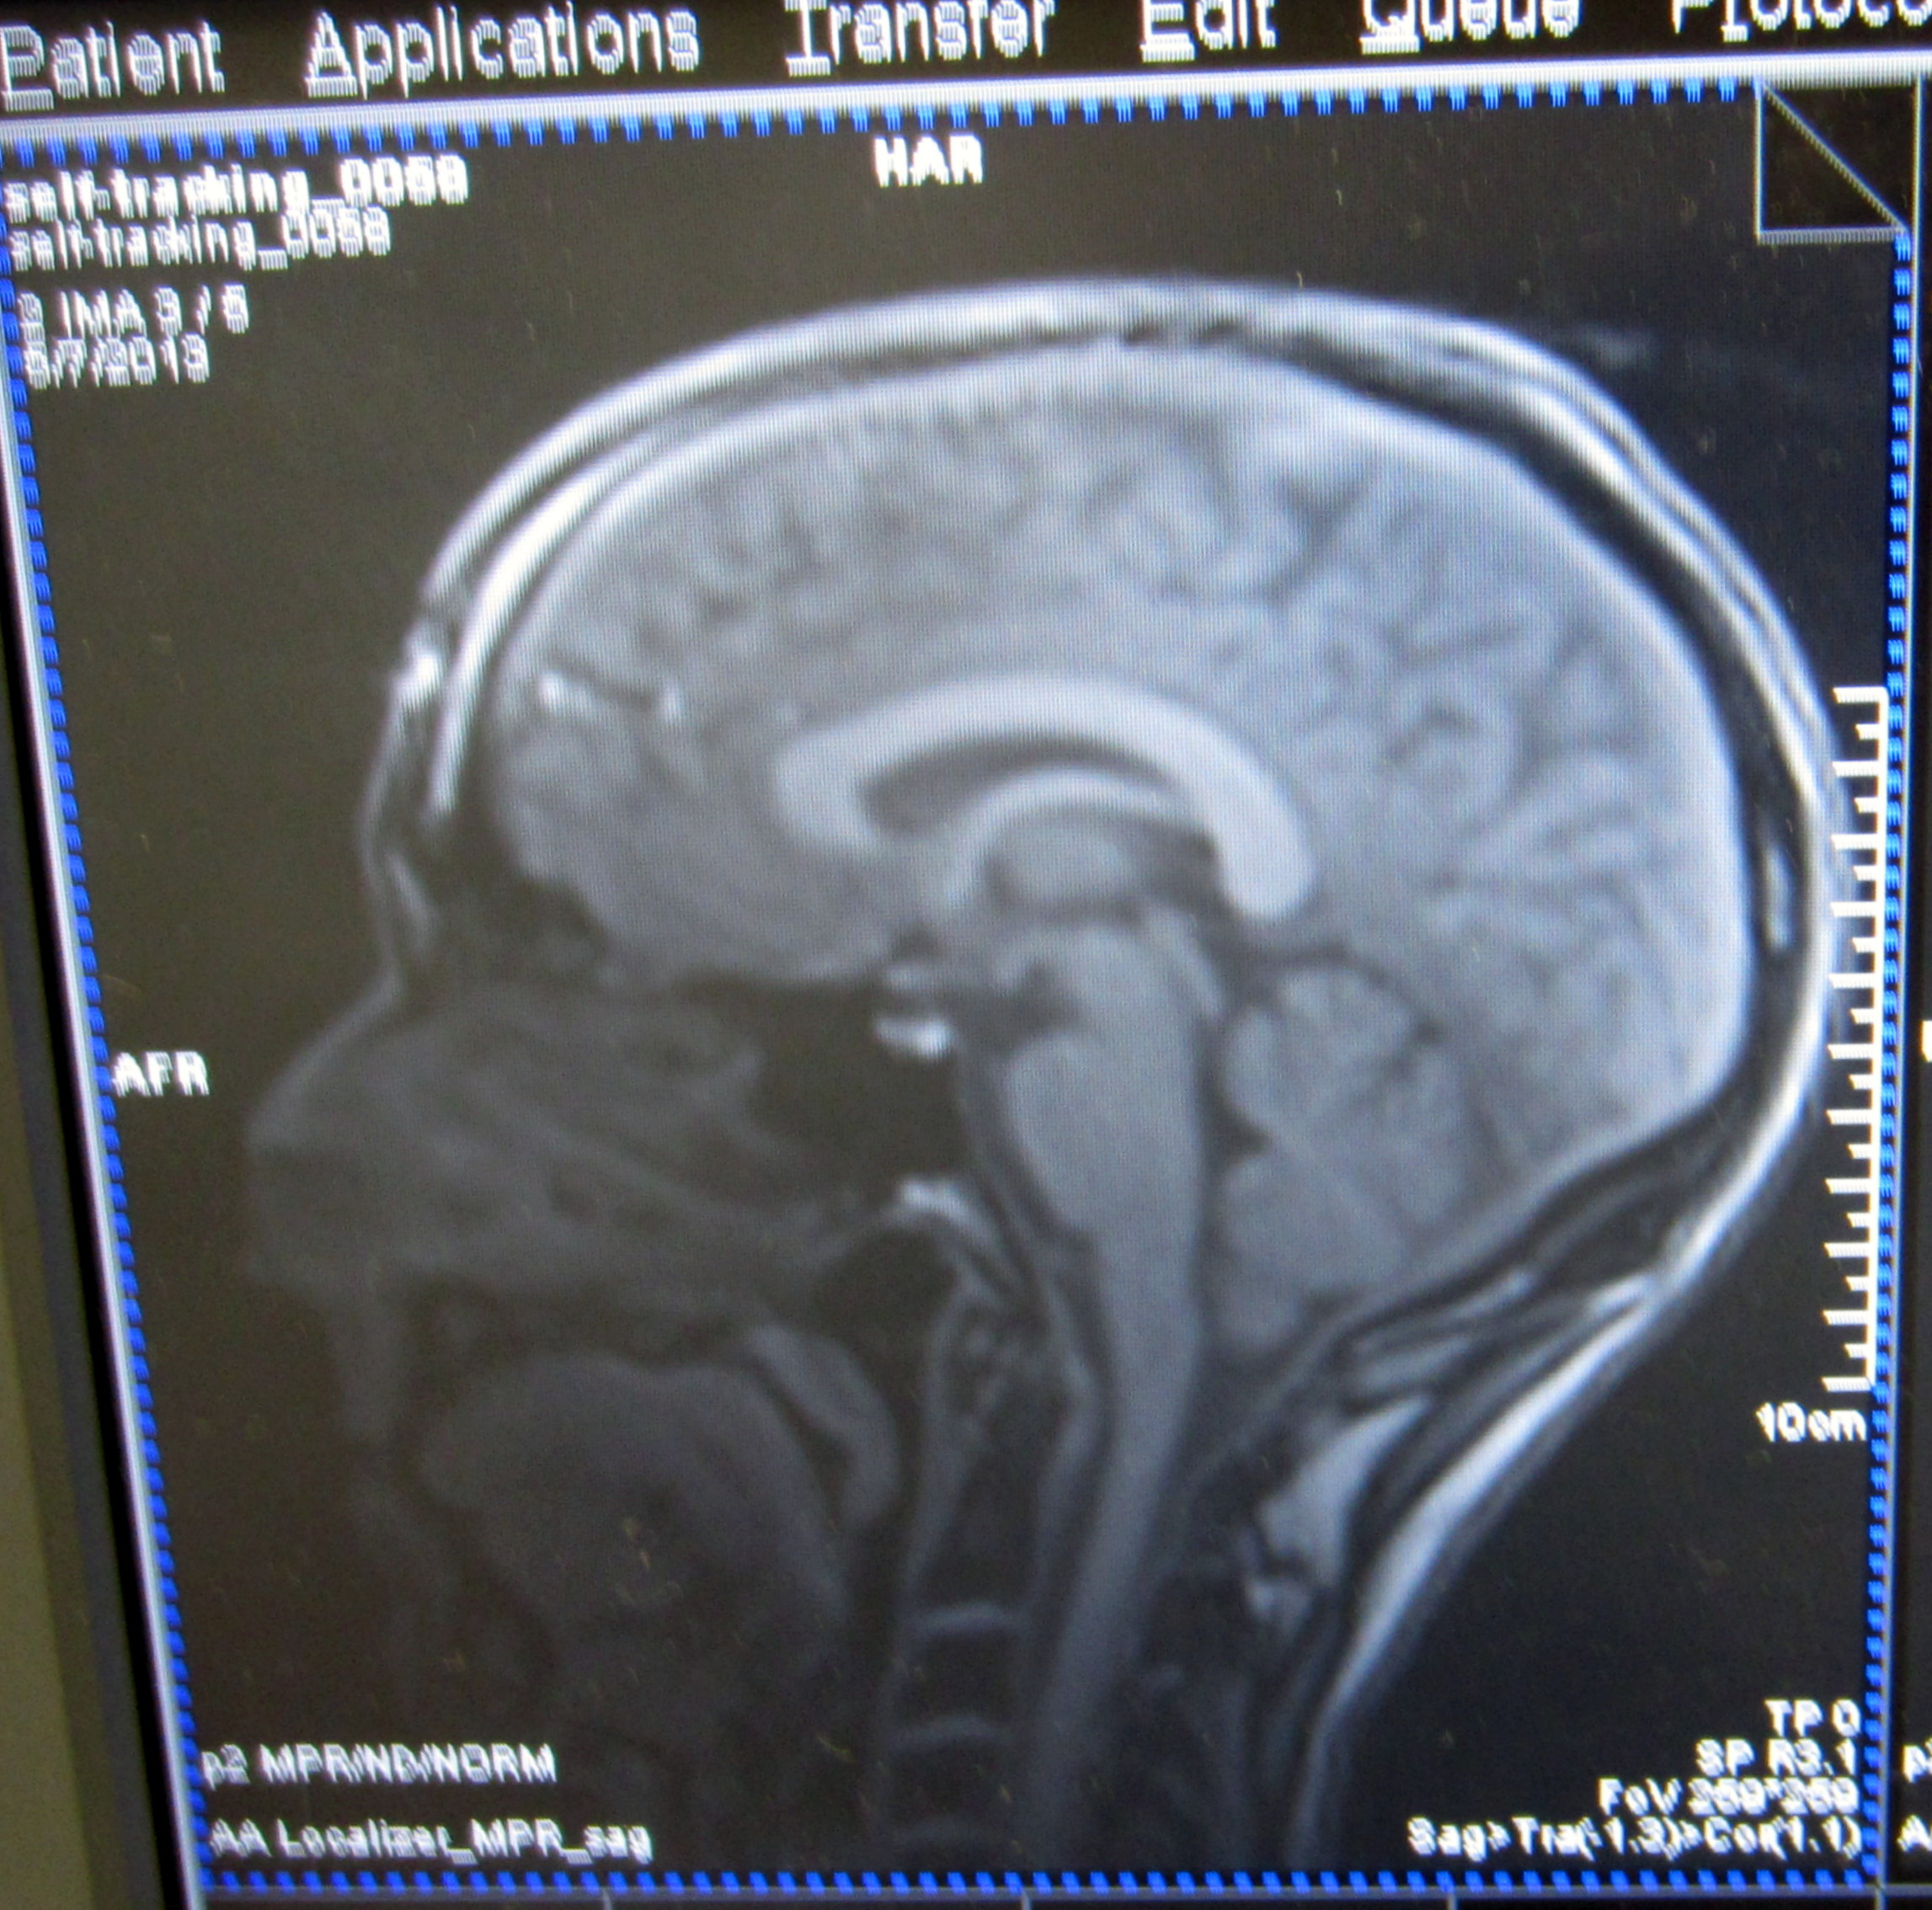
Credit Matt Largey/KUT News
An image of Poldrack's brain from an MRI on May 7, 2013.
Those questions are already starting to take shape. A little more than halfway through, Poldrack is seeing some patterns emerge.
“For example, we see some relationships across days between my general positive mood and brain function," he said. "We also see some relationships between my blood pressure on those days and brain function. So we’re starting to see some patterns. There’s still a lot more to do, because we need a lot more data.”
Poldrack will keep collecting data on himself at least through the end of the year. After that, he’s hoping to find some brave volunteers to take his place in the MRI machine.
Experiments in self-tracking - article in Second Sight
/I met Paul at the Quantified-Self conference last year, and he asked to write an article for Second-Sight in the Netherlands, both a blog and a physical magazine, with a genuine transhumanist orientation....as my friend Adam Curry likes to call me ;-). It captures a little history of the Quantified-Self and sweetly summarizes my Ted talk, and makes a nice post. Thanks Paul! Laurie Frick - Experiments in self tracking | Article in Second Sight magazine June 2013 issue - Paul van den Bosch

Wouldn't you like to get to know yourself better? Laurie Frick does, so she collects metrics of herself and creates hand-built works and installations with beautiful patterns and colorful rhythms. Inspired by neuroscience she uses her work to get a deeper understanding of the nature of pattern and the mind.
As a former executive of a high tech company with a background in high technology and engineering she is no stranger to numbers. After she retired early, 10 years ago, she started a new career, this time as an artist. She now spends most of her time in Austin (Texas) and New York and has been awarded various residencies including one by the UT Neuroscience Imaging Research Center.
Frick became interested in the notion of little bits of time and why we jump from one thing to the next, so she began trying to capture a little diary of how she spent her time. She soon realized it was incredibly difficult to do, so she started measuring her sleep cycles as an easier way to measure how she spent her sleep.
Simultaneously she found Ben Lipkowitz who measured how he spent his minute-by-minute time for the past seven years. At first he just wondered how much time he needed doing the dishes, but this simple measurement evolved into an incredible life-logging project. In Frick’s words “demonstrating the subliminal, underlying metrics of a person, all these measurements became like a data portrait measured and captured of you”. This is how she got involved in the Quantified Self movement. The "Living by Numbers" movement was originally started by Gary Wolf and Kevin Kelly, editors of Wired Magazine. They noticed that a lot of people were measuring certain aspects of their life and thanks to the increased availability of wearable sensors, combined with wearable computing and wireless communication were collecting data about themselves, creating visualizations and looking for meaning in these numbers. People started to meet, explaining what and how they measured themselves.
Currently more than 100 Quantified Self groups exist all over the world. Self tracking has become popular and many devices are available. People use activity trackers such as the Fitbit or Nike+ Fuelband, hook themselves up to sleep monitors, perform biometric measurements, monitor their blood glucose and food intake, and even have their genetic profile mapped. Tracking yourself is no longer limited to making sure you don’t weigh to much, but is becoming a means to learn more about yourself and to collect detailed, objective information about your health.
 Frick started to measure her life in great detail; she recorded how she slept, kept a log of her walking and travel patterns, measured her heart rate, collected speech patterns, made notes of the food she ate, how much time she spent online, and more. Being an artist she then started to work with all these data, trying to make sense of them in a visual way. It is interesting to see how she works, for example how she processed her sleep data into a work of art. She started by measuring her sleep using a Zeo, a device with a headband that measures your EEG and records the sleep state you’re in. She exported the sleep data into an excel sheet and used colors to represent each sleep state. Using these as a starting point she made lots of drawings. She then collected all kinds of pieces of wood that she used to create the final artworks.
The one feature that stands out in her work are the recurring patterns: her idea is that innate patterns of behavior and body function are like an individual fingerprint. Literally everything you start to imagine that can be measured creates a portrait of you. You have an individual rhythm that’s particular to you and it can also reflect who you are. She discovered for example that her sleep patterns are pretty steady. She has a very low standard deviation of her sleep score, versus her husband whose sleep score swings wildly. She realized it was a reflection of both their personalities.
Laurie Frick thinks self-tracking will become invisible, embedded into apps that we use and don’t even think about. Self-tracking data will be pervasive, for example our clothes will have sensors that know how much we moved our arms and legs, and thus will send accurate data about our caloric expenditure to our Fitbit or Nike+ Fuelband dashboard. Our watch will track our heart-ratevariability and give us little stress alerts. Laurie Frick's best fantasy is that all our data will be turned into a patterned wall texture that is spit out from a 3D printer in the walls of our home. It will be recyclable and updatable, giving us feedback about our activities and the changes in our body, allowing us to adjust your behavior and tweak our daily habits. “We will create human data portraits as art on our walls: mindfulness made tangible".
When asked if she thinks her artwork could be a source of inspiration for science, she replies she doesn’t want to presume an artist could have an effect on scientific research. But she mentions an interesting subject. It seems that the work on the human Connectome project to map the pattern of connections in the brain might find there is an innate pattern of you. It’s a rhythm that is inherently familiar and repeats itself in many facets of the person you are. And strangely enough there is a resonance when you encounter those same patterns in the real world. Frick’s art give us an intimate look into her own patterns.
She also thinks big data research teams can learn from artists on how to deliver data that is addictive, beautiful and something you want to look at. Much of the self-tracking data graphics is so literal and dull, that it is hard for the average person to discover any meaning in all those data points. How do you for example determine the relationship between your mood, your physical location and the time of day? But if the visual presentation of data were to be artified, it would make it a lot easier to understand.
Even if science isn't inspired by art Frick’s work shows that art can teach us about ourselves, just as science does. Frick's art reveals a person's innermost patterns and maybe one day we will be gazing at the walls of our living room looking at these beautiful patterns, and gain a deeper understanding of who we are.
Will our 'digital social pulse' diagnose and predict our behaviour?
/Was struck by the phrase 'Digital Social Pulse' from Deborah Estrin at TEDMED last week, chatted with her and the Open mHealth initiative, working to fix the data API problem with a clean standard. But mostly she reinforced this idea about the data of YOU having diagnostic and predictive ability. That coupled with a request also last week from a public spaces project asking for a super short public art proposal, I thought about how we can use both data collected about us, with data collected in a neighborhood and begin to build a narrative....a story that helps us understand ourselves and the places we live.

Our ‘digital social pulse’ will be the way we live and how we move through the world. Imagine when city streets will be both smart and how we discover and understand more about ourselves. It’ll be fun. It will be beautiful. It will support our need as humans to feel apart of our community.
Connect self-tracking data gathered from GPS and accelerometers on our phone, fitbit devices, fuelbands, watch sensors with crowd-sourced proximity data gathered in the downtown neighborhood to accumulate and build a narrative story about how people walk, shop, eat, drive and encounter random experiences in an urban neighborhood.
Connect the small-data of you, your digital social pulse with how an urban downtown functions as a social space.
Draw people into repetitive experiences where their presence builds and adds to the narrative of the downtown street-scene. Lure them toward experiences with small curious installations to alter their normal path. Offer a visible method for pedestrians and riders to signal on their phone when they are contributing. Allow people to learn something new about their patterns and see something about themselves they wouldn't normally notice. Delight and surprise. Combine the digital with the physical.
We move through spaces and sense the scale of human proportions, distance and space. We move in close when something grabs our attention and unconsciously walk toward it. Chance conversations can shift our mood. Something bright and shiny in the distance can shift our path and pull us toward it.
 My focus in the past year has been tracking movement and travel by walking and photo gathering through a city. I’m using a fitbit and Basis watch which tracks steps, temperature and pulse. Openpaths, which gathers time and GPS coordinates. I often supplement with time-lapse photography using a little camera I wear around my neck to document the visual experience. The art installation pieces use underlying algorithms – as I experiment with ways to use weather, color, sense and data to build human data portraits from patterns of behaviour.
Every time I look at future scenarios of data tracking – it takes on a hugely sinister theme. Intense fear, worry, anxiety, loss of privacy to government agencies or global brand advertisers is the typical response. At times I think it is inevitable. Every bit of data about us will be known. Should we worry, or can we personally begin to know more and self-experiment. Rather than just be fearful, we might grab even more data and play with it, test it out, experiment with how it feels and build something we desire and embrace.
So, in anticipation of a time where total surveillance is normal, sensors are seamlessly embedded in our clothes and in tiny bits we swallow with vitamins. Location coordinates are gathered from phones and recordings of what we see, say and hear are invisibly captured, I've been collecting data to experiment and test ways of converting data into abstract patterns which can communicate encoded meaning about us and how we live in the neighborhoods we love.
There is an opportunity to connect the data we gather about ourselves and marry it with the data collected about how we live and move thru a downtown neighborhood. There is a story that can be created and the combination can be illuminating.